gavanganung.comChart Book
Chart
book°
The best way to recognize a big winner is to study hundreds of them. I pulled the large-cap stocks that ran at least 50% after a breakout in the last five years and then completed a full cycle, charted each one, and looked for what they had in common.
Chart Book°02
Twelve from the book°
+79%
median gain off the 52-week low by the breakout; every one was up at least +32%.
5 of 12
were profitable, with EPS above a year earlier, in the report before the breakout. Most of the earnings growth came after.
−33%
median deepest pullback on the way to the peak.
+36%
median kept by selling on the first close below the 30-week average, against a median peak of +470%.
APPApplovin · Communication Services
Breakout Jun 16, 2023
Already up 162% off its low at the breakout, sat through a 57% drop mid-run, and still finished as the biggest winner here.
Before · what you could seeDaily, one year
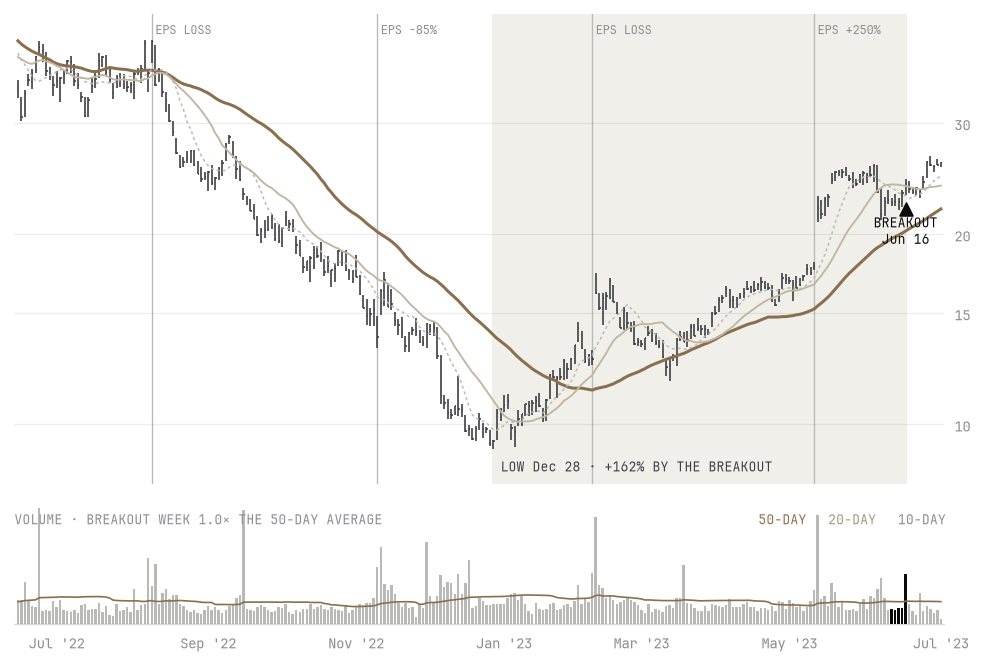
- Off the 52-week low
- +162%
- Versus the 52-week high
- −41%
- Relative strength vs S&P 500
- +8
- Breakout-week volume vs average
- 1.0×
- EPS in the last report, year over year
- +250%
After · what it didWeekly
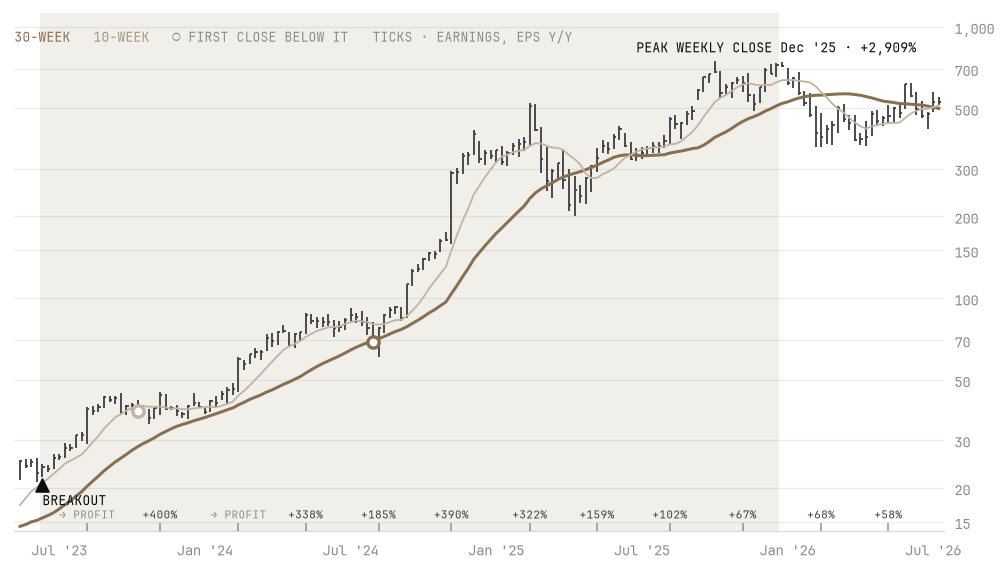
- Peak weekly close (Dec 2025)
- +2,909%
- Weeks to the peak
- 131
- Deepest pullback on the way
- −57%
- Earnings beats during the run
- 7 of 10
- Sold on the first close below the 10-week
- +61%
- Sold on the first close below the 30-week
- +187%
PLTRPalantir · Technology
Breakout May 18, 2023
The textbook case: a new 52-week high, twice normal volume, and EPS up 150% in the report just before.
Before · what you could seeDaily, one year
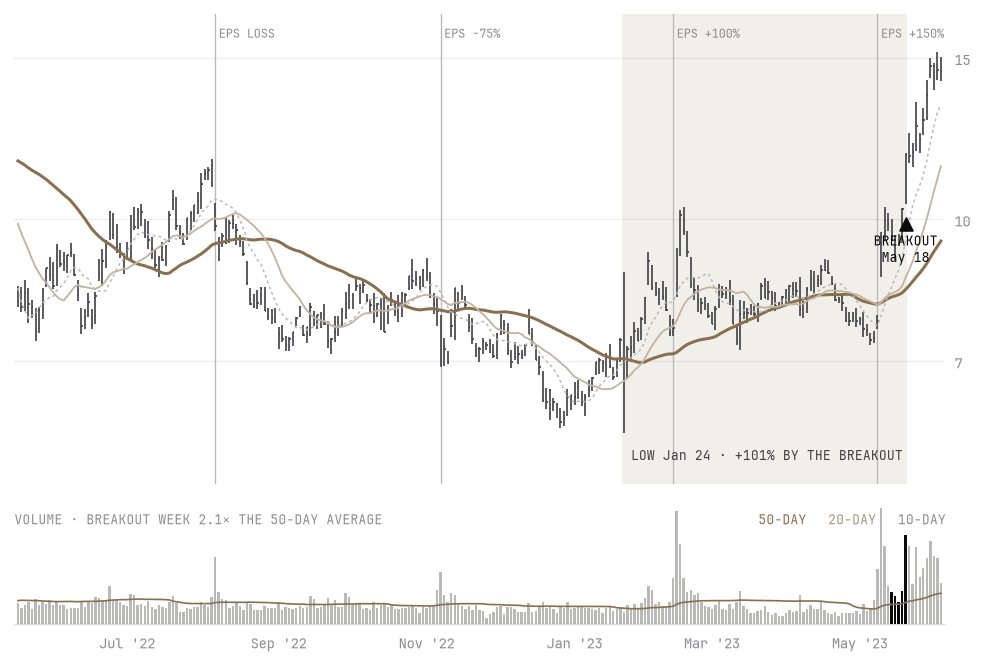
- Off the 52-week low
- +101%
- Versus the 52-week high
- New high
- Relative strength vs S&P 500
- +11
- Breakout-week volume vs average
- 2.1×
- EPS in the last report, year over year
- +150%
After · what it didWeekly
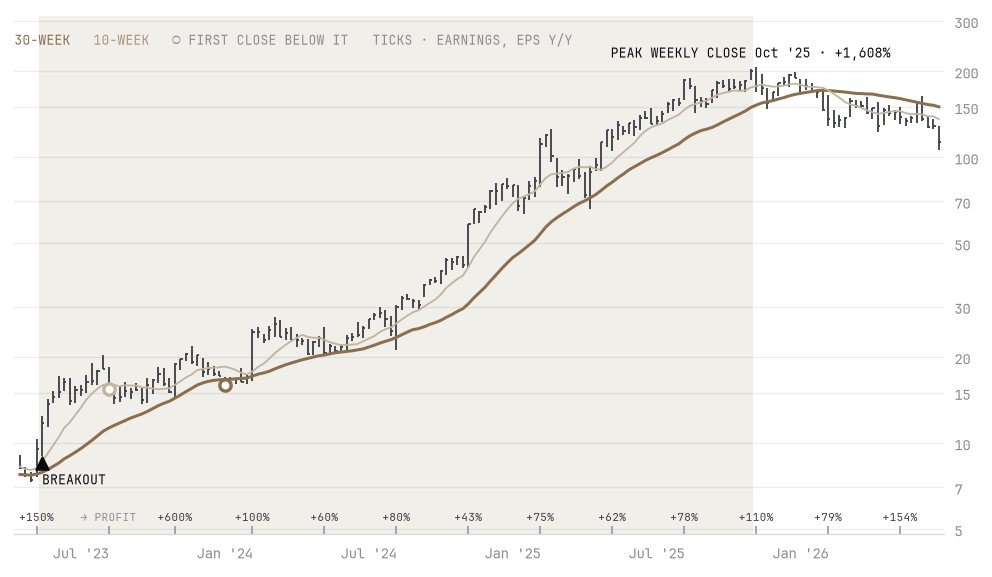
- Peak weekly close (Oct 2025)
- +1,608%
- Weeks to the peak
- 128
- Deepest pullback on the way
- −38%
- Earnings beats during the run
- 5 of 9
- Sold on the first close below the 10-week
- +31%
- Sold on the first close below the 30-week
- +36%
HOODRobinhood · Financial Services
Breakout Jul 28, 2023
Both exit signals fired within two months, at a loss. The whole +1,068% came after.
Before · what you could seeDaily, one year
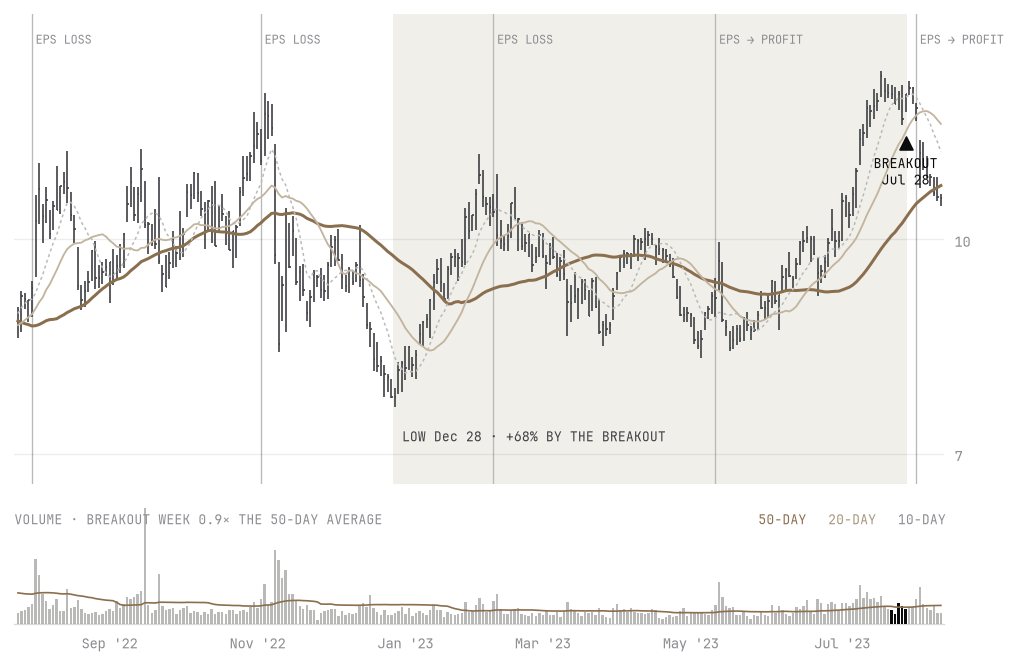
- Off the 52-week low
- +68%
- Versus the 52-week high
- −4%
- Relative strength vs S&P 500
- +14
- Breakout-week volume vs average
- 0.9×
- EPS in the last report, year over year
- Turned profitable
After · what it didWeekly
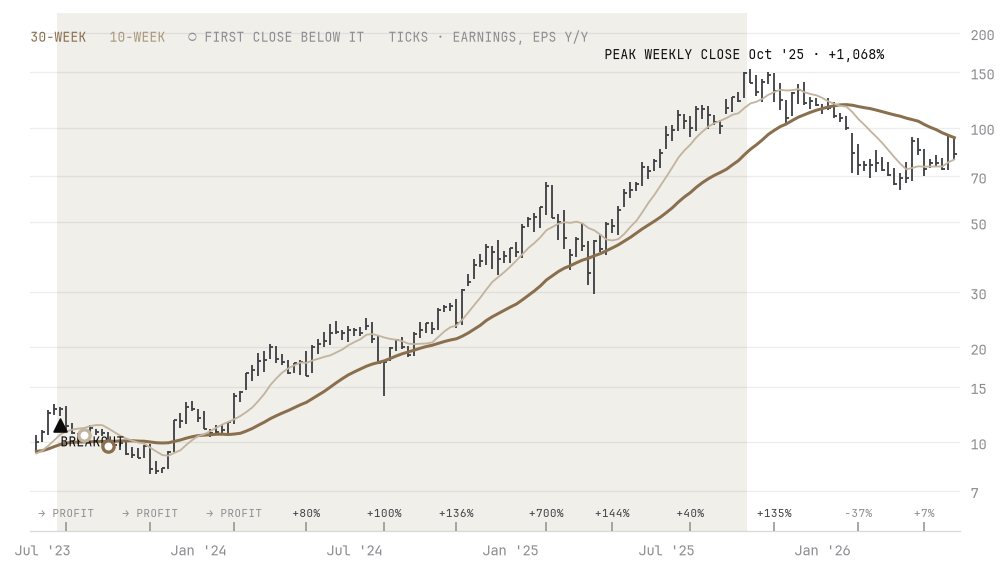
- Peak weekly close (Oct 2025)
- +1,068%
- Weeks to the peak
- 114
- Deepest pullback on the way
- −47%
- Earnings beats during the run
- 7 of 9
- Sold on the first close below the 10-week
- −17%
- Sold on the first close below the 30-week
- −24%
VSTVistra · Utilities
Breakout Nov 19, 2021
Broke out lagging the S&P with erratic earnings, then took nearly four years to peak.
Before · what you could seeDaily, one year
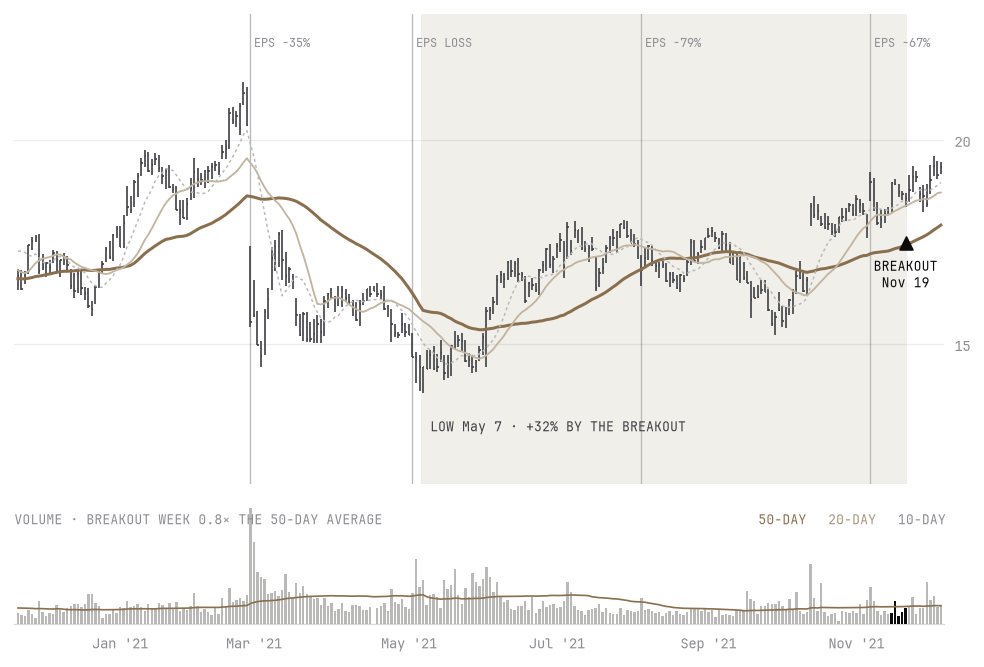
- Off the 52-week low
- +32%
- Versus the 52-week high
- −15%
- Relative strength vs S&P 500
- −4
- Breakout-week volume vs average
- 0.8×
- EPS in the last report, year over year
- −67%
After · what it didWeekly
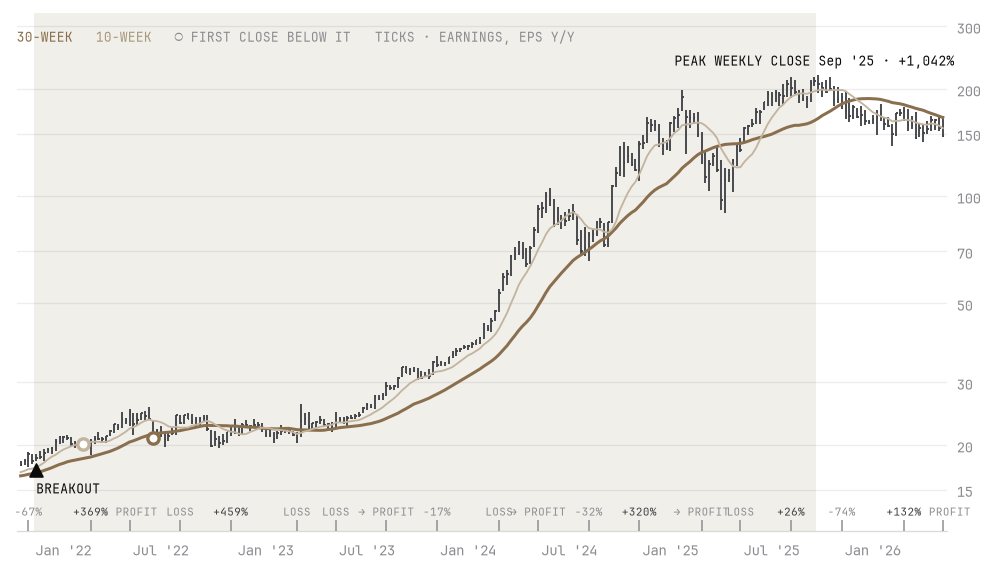
- Peak weekly close (Sep 2025)
- +1,042%
- Weeks to the peak
- 200
- Deepest pullback on the way
- −49%
- Earnings beats during the run
- 5 of 15
- Sold on the first close below the 10-week
- +10%
- Sold on the first close below the 30-week
- +14%
VRTVertiv · Industrials
Breakout Dec 9, 2022
Broke out 49% below its high on light volume. The next report showed EPS up 600%.
Before · what you could seeDaily, one year
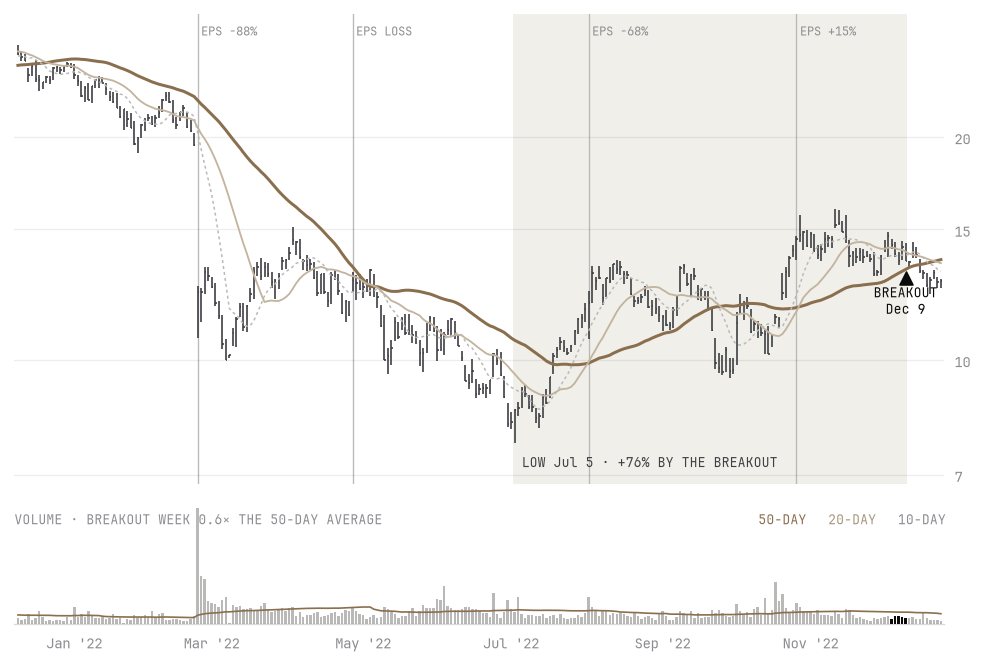
- Off the 52-week low
- +76%
- Versus the 52-week high
- −49%
- Relative strength vs S&P 500
- +3
- Breakout-week volume vs average
- 0.6×
- EPS in the last report, year over year
- +15%
After · what it didWeekly
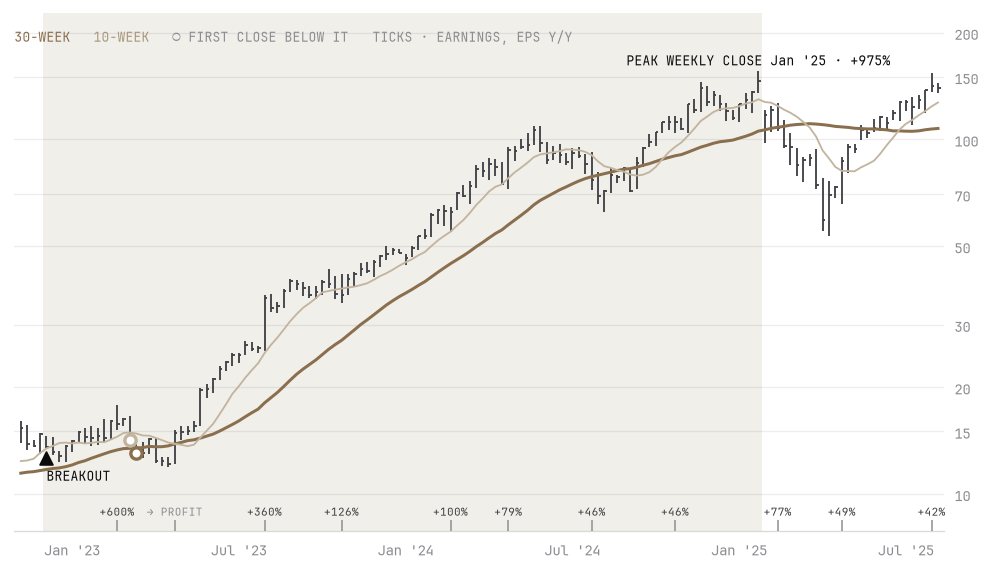
- Peak weekly close (Jan 2025)
- +975%
- Weeks to the peak
- 111
- Deepest pullback on the way
- −35%
- Earnings beats during the run
- 7 of 8
- Sold on the first close below the 10-week
- +4%
- Sold on the first close below the 30-week
- −4%
NVDANVIDIA · Technology
Breakout Feb 17, 2023
Price led earnings. EPS was down 50% at the breakout; the +429% quarter came six months later.
Before · what you could seeDaily, one year
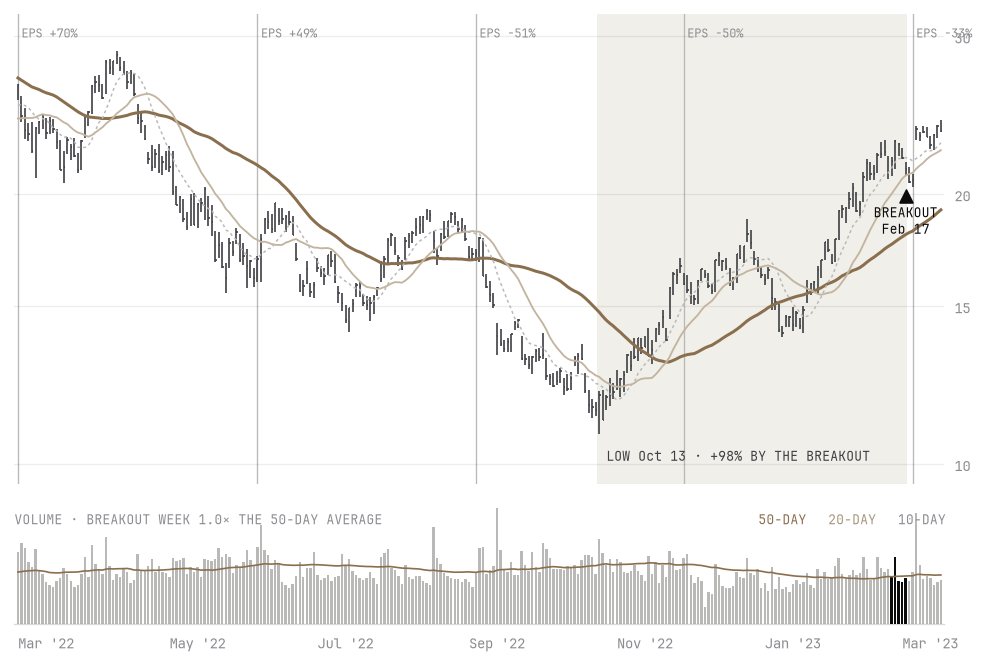
- Off the 52-week low
- +98%
- Versus the 52-week high
- −26%
- Relative strength vs S&P 500
- +20
- Breakout-week volume vs average
- 1.0×
- EPS in the last report, year over year
- −50%
After · what it didWeekly
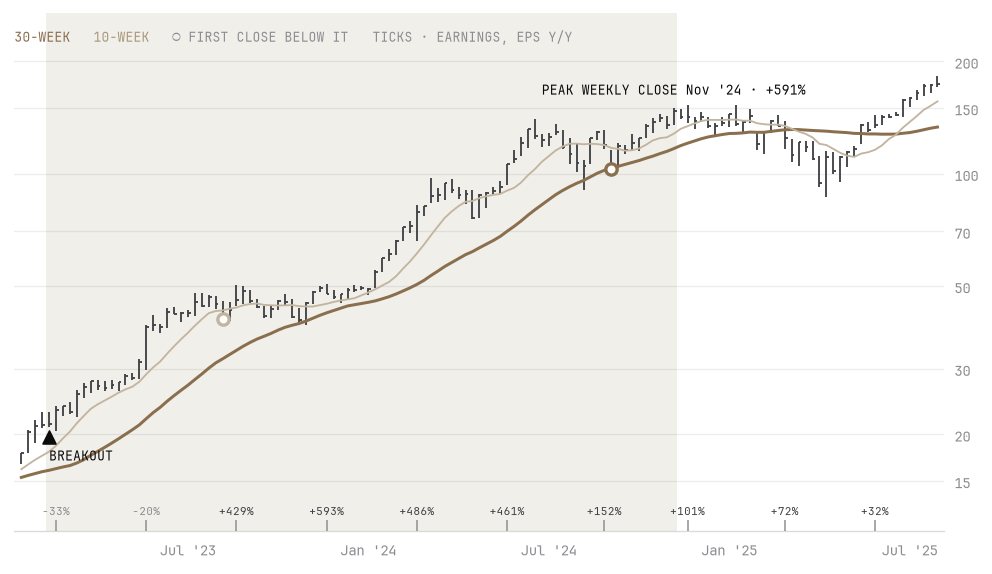
- Peak weekly close (Nov 2024)
- +591%
- Weeks to the peak
- 90
- Deepest pullback on the way
- −22%
- Earnings beats during the run
- 7 of 7
- Sold on the first close below the 10-week
- +91%
- Sold on the first close below the 30-week
- +381%
AXONAxon · Industrials
Breakout Nov 16, 2022
The strongest relative strength in the set at the breakout, and 11 beats in 11 reports on the way up.
Before · what you could seeDaily, one year
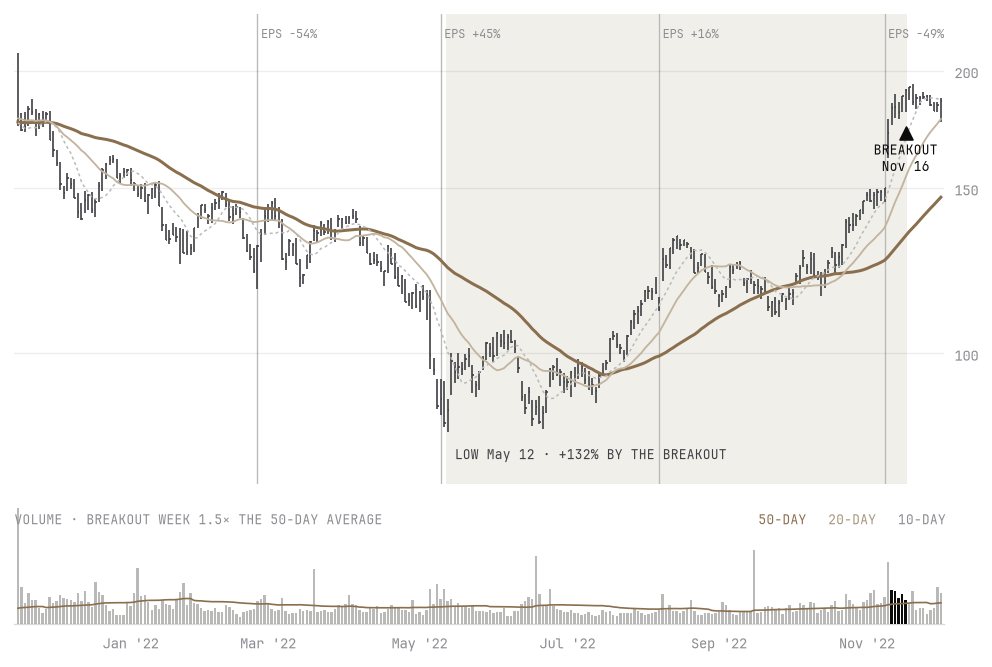
- Off the 52-week low
- +132%
- Versus the 52-week high
- −9%
- Relative strength vs S&P 500
- +51
- Breakout-week volume vs average
- 1.5×
- EPS in the last report, year over year
- −49%
After · what it didWeekly
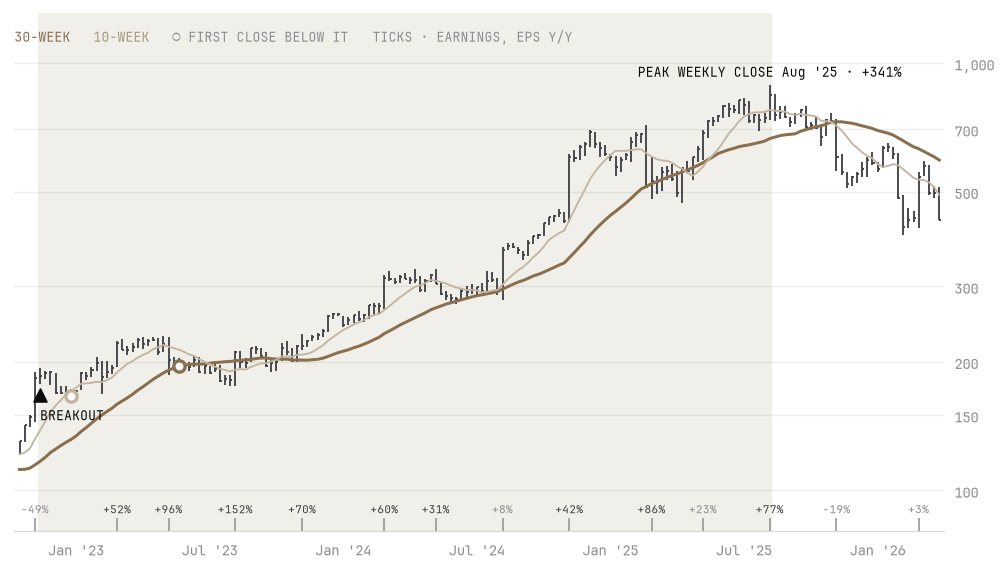
- Peak weekly close (Aug 2025)
- +341%
- Weeks to the peak
- 142
- Deepest pullback on the way
- −28%
- Earnings beats during the run
- 11 of 11
- Sold on the first close below the 10-week
- −13%
- Sold on the first close below the 30-week
- +2%
NFLXNetflix · Communication Services
Breakout Dec 23, 2022
Broke out 52% below its high, on half its normal volume, with the S&P still 19% below its own high.
Before · what you could seeDaily, one year
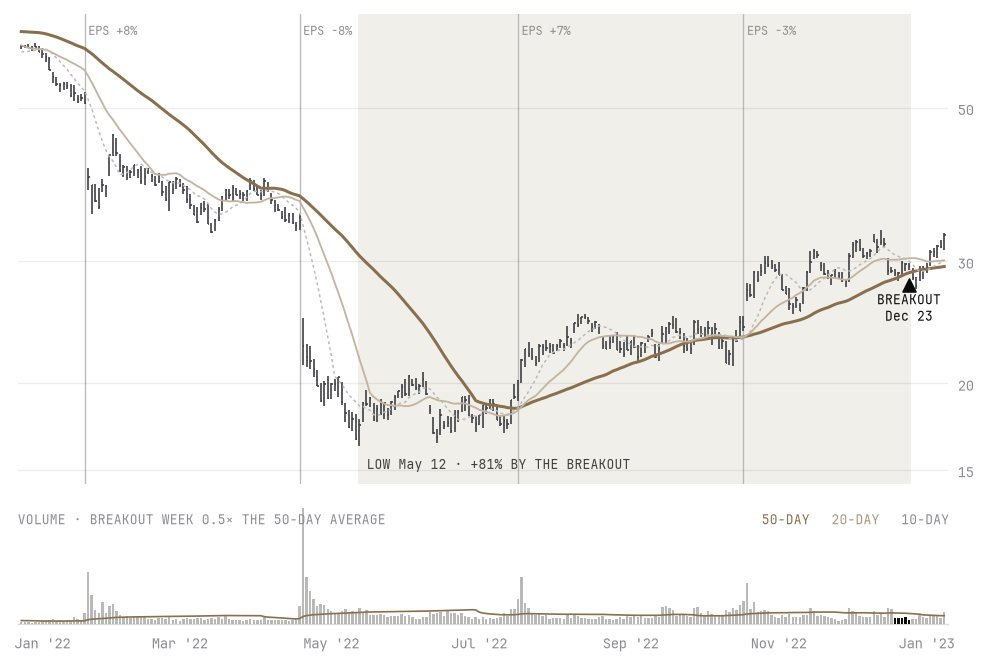
- Off the 52-week low
- +81%
- Versus the 52-week high
- −52%
- Relative strength vs S&P 500
- +10
- Breakout-week volume vs average
- 0.5×
- EPS in the last report, year over year
- −3%
After · what it didWeekly
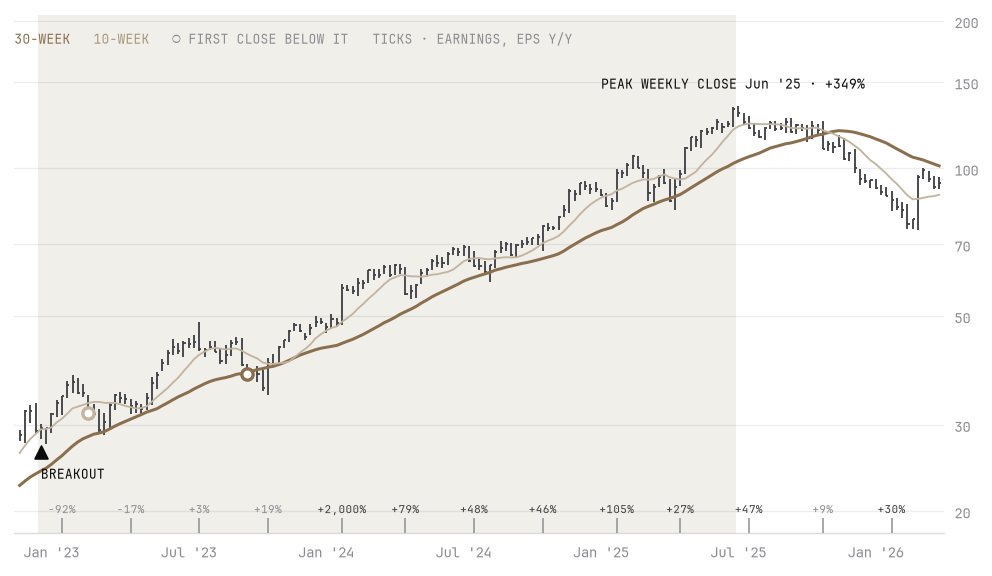
- Peak weekly close (Jun 2025)
- +349%
- Weeks to the peak
- 131
- Deepest pullback on the way
- −20%
- Earnings beats during the run
- 7 of 10
- Sold on the first close below the 10-week
- +7%
- Sold on the first close below the 30-week
- +29%
FICOFair Isaac · Technology
Breakout Nov 25, 2022
The steadiest of the twelve: EPS grew every quarter and the worst pullback was 16%.
Before · what you could seeDaily, one year
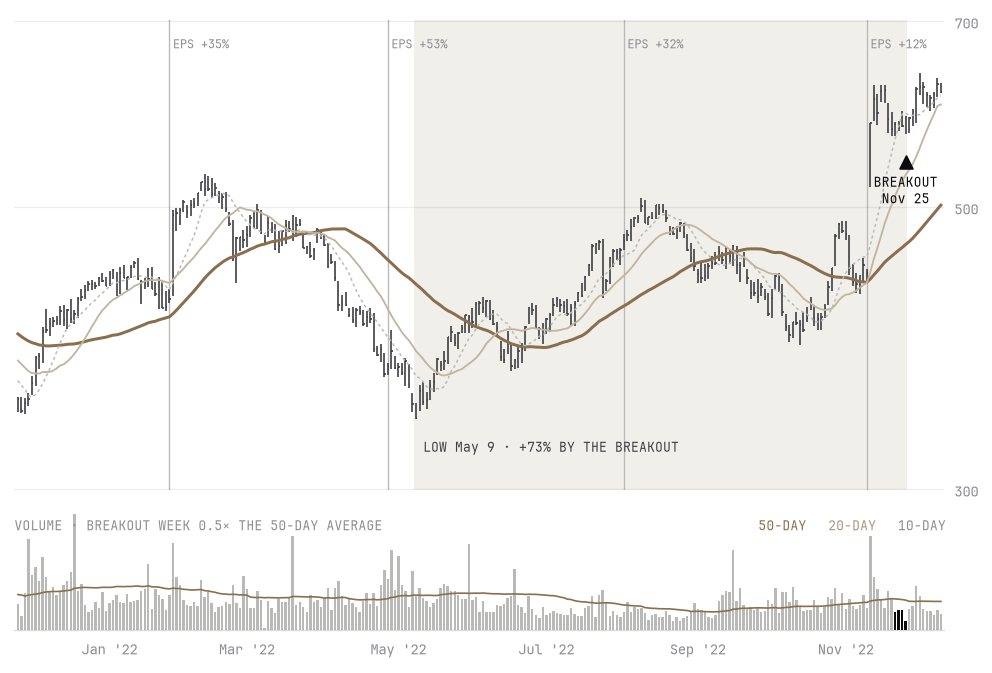
- Off the 52-week low
- +73%
- Versus the 52-week high
- −6%
- Relative strength vs S&P 500
- +35
- Breakout-week volume vs average
- 0.5×
- EPS in the last report, year over year
- +12%
After · what it didWeekly
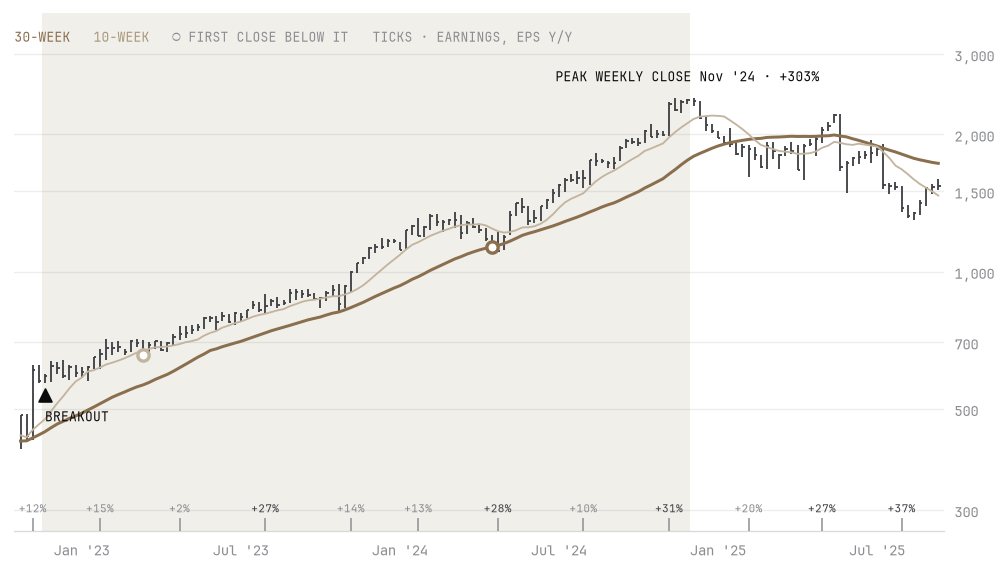
- Peak weekly close (Nov 2024)
- +303%
- Weeks to the peak
- 105
- Deepest pullback on the way
- −16%
- Earnings beats during the run
- 4 of 8
- Sold on the first close below the 10-week
- +11%
- Sold on the first close below the 30-week
- +92%
CEGConstellation Energy · Utilities
Breakout Aug 8, 2023
Broke out at a 52-week high, then gave back 51% before it made its peak.
Before · what you could seeDaily, one year
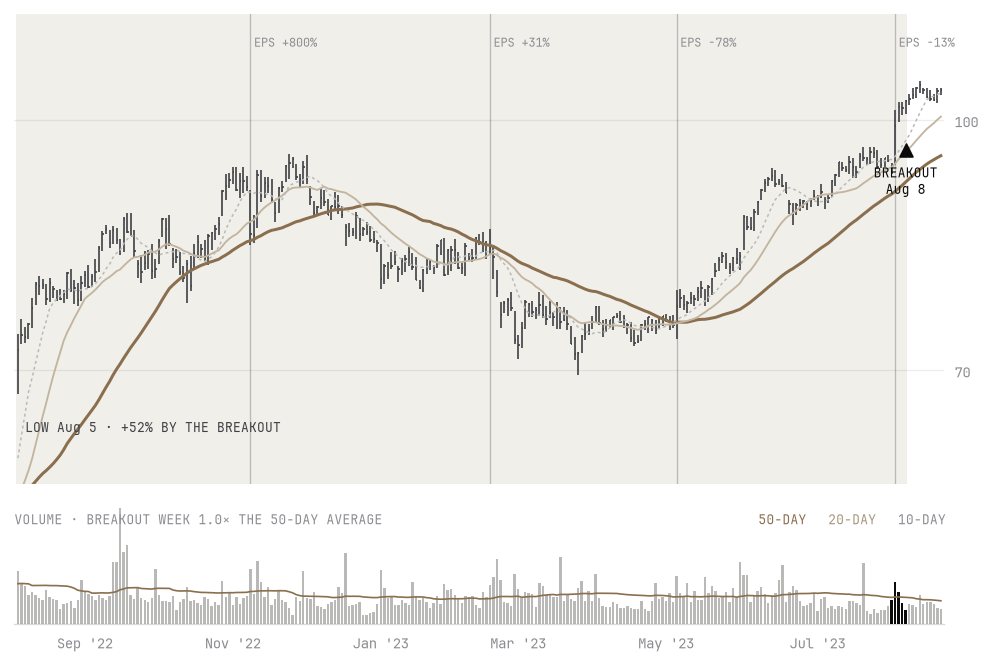
- Off the 52-week low
- +52%
- Versus the 52-week high
- New high
- Relative strength vs S&P 500
- +10
- Breakout-week volume vs average
- 1.0×
- EPS in the last report, year over year
- −13%
After · what it didWeekly
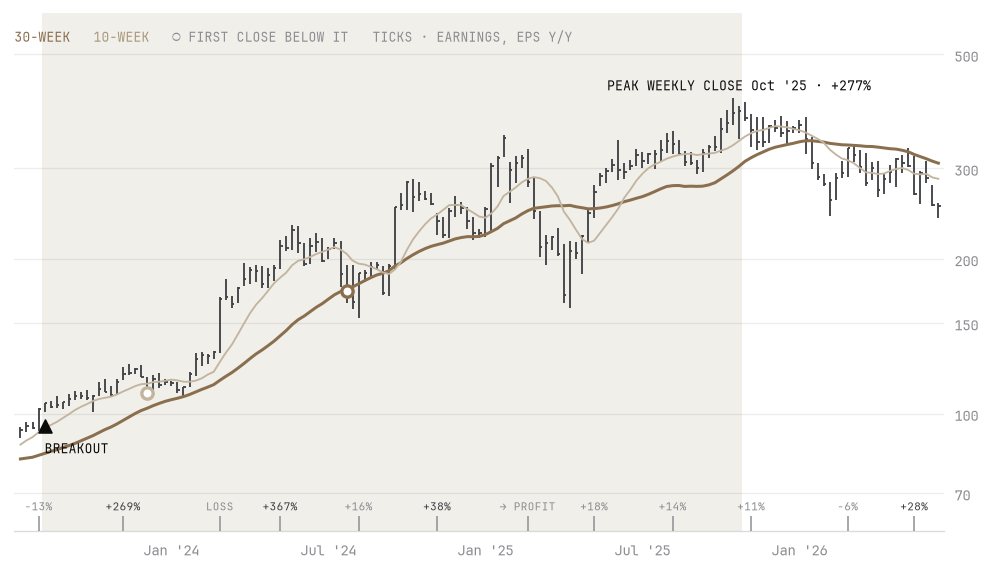
- Peak weekly close (Oct 2025)
- +277%
- Weeks to the peak
- 115
- Deepest pullback on the way
- −51%
- Earnings beats during the run
- 5 of 8
- Sold on the first close below the 10-week
- +7%
- Sold on the first close below the 30-week
- +68%
METAMeta · Communication Services
Breakout Mar 24, 2023
EPS was down 52% at the breakout and still down 19% the next quarter. Two reports later it was up 168%.
Before · what you could seeDaily, one year
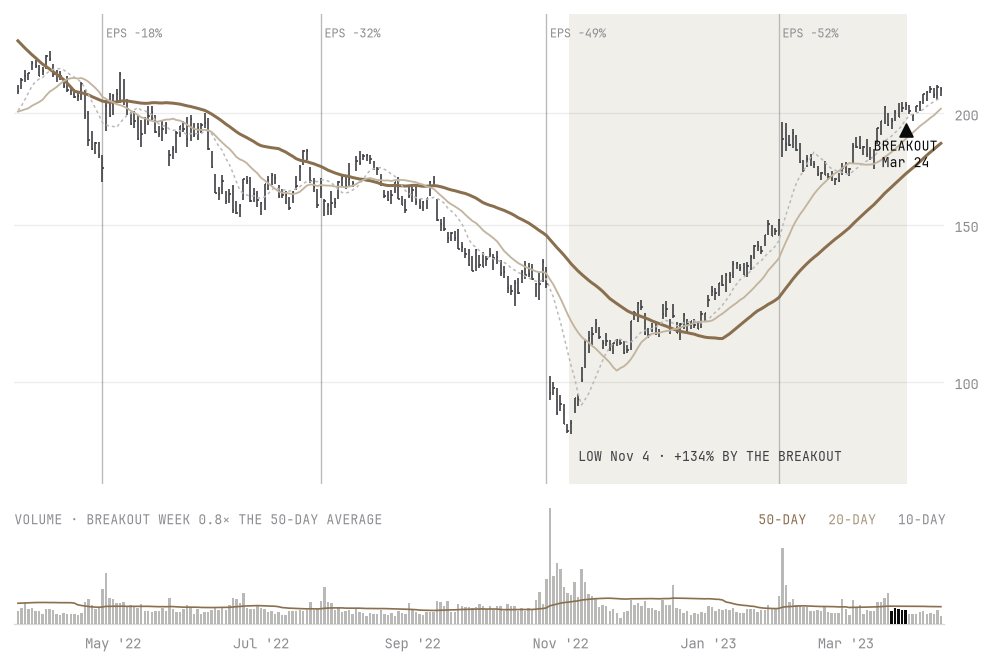
- Off the 52-week low
- +134%
- Versus the 52-week high
- −13%
- Relative strength vs S&P 500
- +28
- Breakout-week volume vs average
- 0.8×
- EPS in the last report, year over year
- −52%
After · what it didWeekly
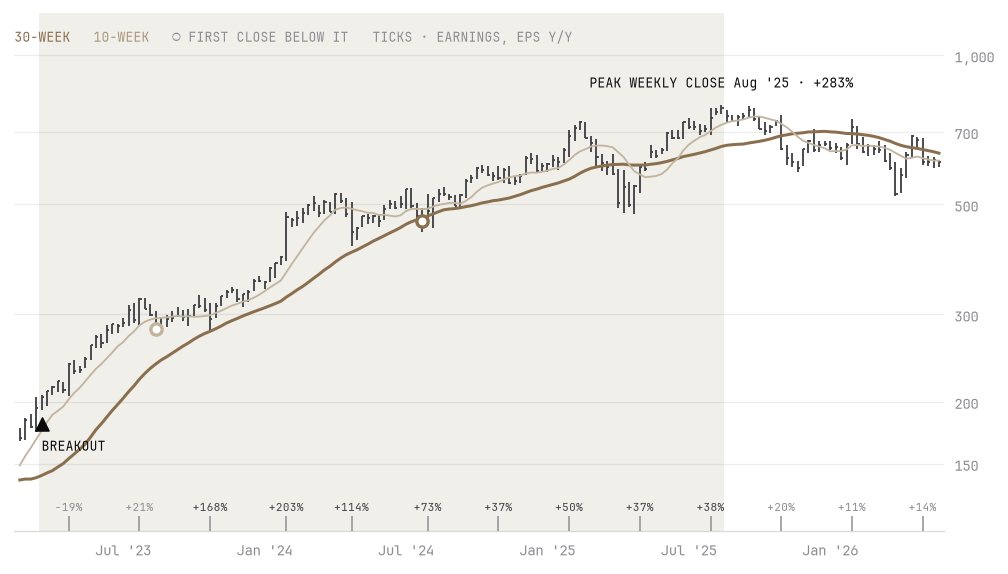
- Peak weekly close (Aug 2025)
- +283%
- Weeks to the peak
- 125
- Deepest pullback on the way
- −32%
- Earnings beats during the run
- 10 of 10
- Sold on the first close below the 10-week
- +37%
- Sold on the first close below the 30-week
- +127%
UBERUber · Technology
Breakout Jan 20, 2023
Still losing money at the breakout. It turned profitable during the run.
Before · what you could seeDaily, one year
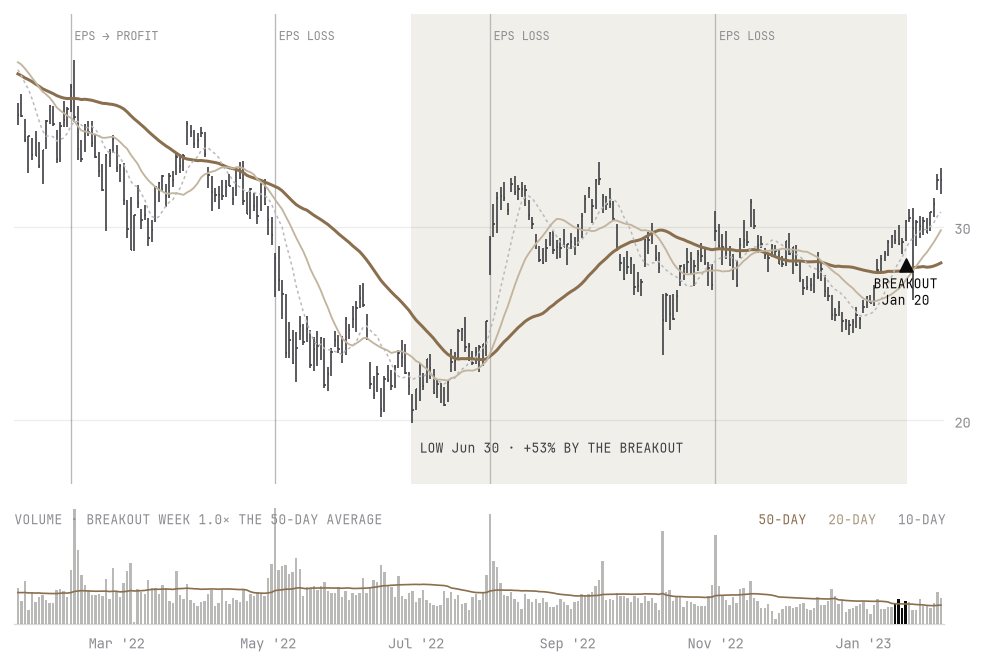
- Off the 52-week low
- +53%
- Versus the 52-week high
- −29%
- Relative strength vs S&P 500
- +8
- Breakout-week volume vs average
- 1.0×
- EPS in the last report, year over year
- Loss
After · what it didWeekly
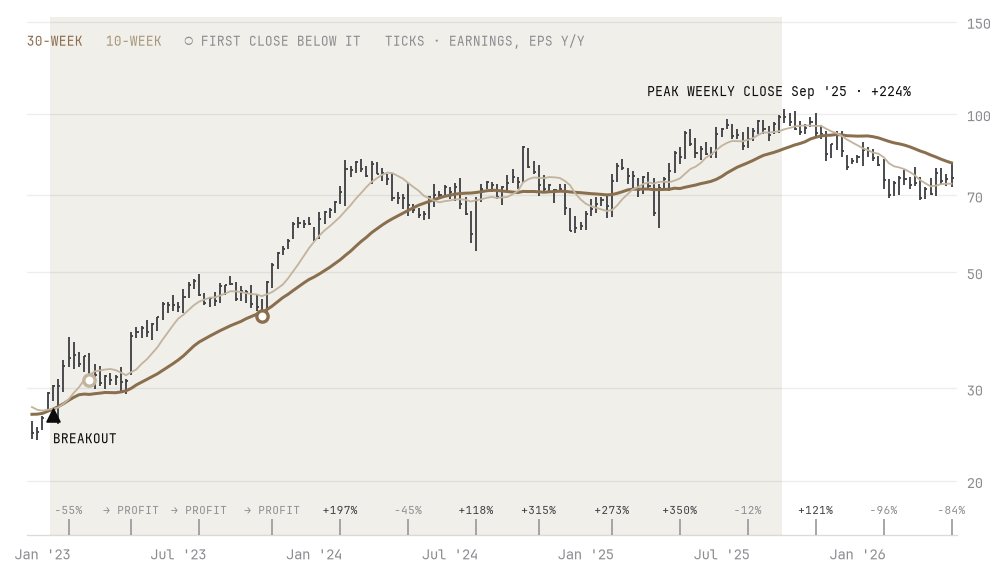
- Peak weekly close (Sep 2025)
- +224%
- Weeks to the peak
- 139
- Deepest pullback on the way
- −31%
- Earnings beats during the run
- 9 of 11
- Sold on the first close below the 10-week
- +2%
- Sold on the first close below the 30-week
- +36%